Thursday, September 14, 2006
Social Node Graph for US Insurance
 The Social Node Graph assisting the most recent studies across the US depicts a high proportion of the masses to have remained uninsured till date. The figures amount to some 42.6 million in the recent times. This has been the consequence of certain critical conditions which could have been eradicated cheaply through the initial stages. But they have turned into a grave concern for the masses of late by generating an acute health crises and demanding expensive healthcare services or ICU care.
Apart from South Africa, the US still remains the only representative of the developed nations, that fails to offer universal coverage to all the citizens. To add to this menace, medical inflation has come up as a big jolt.
There might be a sudden fall in terms of insurance benefits getting awarded to employees or a sharp rise towards their premiums or deductibles.
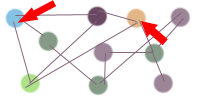
This unforeseen social turmoil could be explained better with the help of a Social Node graph. Lets get to the Blue node and the Orange node depicted in the above graph. Suppose if the Blue node represents an insurance broker or an insurer,
then he ought to reach the Orange node which would be representing a prospective customer. But as we could see from the graph, there is no direct way to reach out to the Orange node. Therefore the insurer or the broker needs to utilize either the social space or an existing one in order to anchor a new network cable. But in doing so he would be heading towards another dilemma, since the network cable would need the consent of both the parties involved and at the sametime it would be a costly social activity.
Subscribe to Posts [Atom]
We believe in all types of Insurance polices specially in Auto Insurance which help us to get ensure all the safety and security of your luxury Car Stereo system also.Cheap Car Insurance
